


Genomics England
Genetic research explained with Genomics England.
Motion-Fox
Genetic research explained with Genomics England.
Motion-Fox

How do you explain genetic research simply? On top of that, how do we explain how geneticists are analysing genetic data differently to account for equality, diversity and inclusion? These were the questions that Genomics England approached Nifty with to help explain their cutting edge data analysis to diverse audiences.

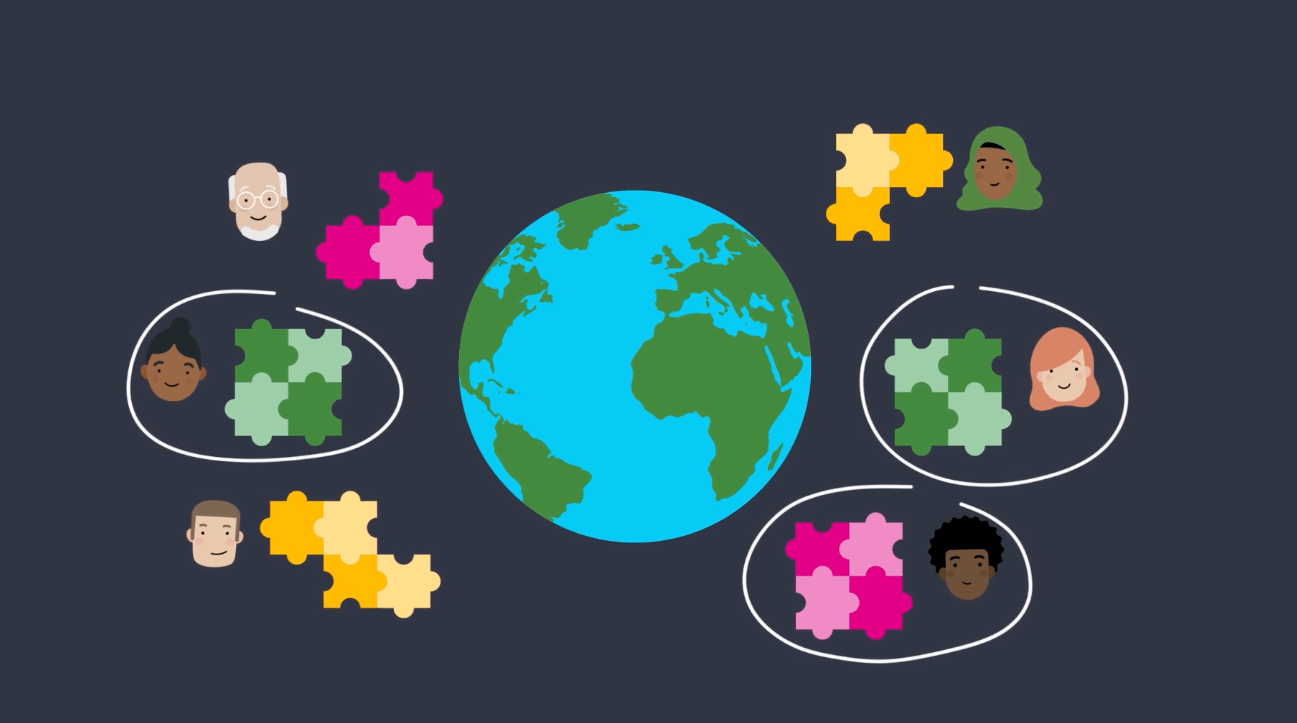
Animation was the answer! We worked with geneticists and public engagement experts at Genomics England to help them break down pan genomes and tree sequencing into an easy to grasp animation script built around a simple visual metaphor: jigsaw puzzles.
Using the jigsaw puzzle metaphor, we were able to explain the intricacies of genetic data analysis for diversity. Specifically, how scientists were using different jigsaw instructions (data analysis methods) to put pieces together in new - more inclusive - ways.
We worked closely with the communications team to align the visual style with brand guidelines whilst still feeling approachable to a wide audience.
The animation is now being used across Genomics England and shared with minoritised communities to start conversations around data diversity.


Ready to tell your story visually?


